This document provides guidance to equalize the low-frequency response of the Dutch & Dutch 8c loudspeaker in rooms. This type of low-frequency equalization is part of the Room Matching functionality of the 8c’s. It's used to compensate for the effect of room acoustics occurring at low frequencies and thereby obtain a “flatter” frequency response of the loudspeakers at the listening position. The equalization is achieved with the built-in digital signal processing of the 8c. The acoustical measurements and the calculation of the equalization filters are done with the free room equalization software REW. This guide assumes that the 8c are running a firmware version 1.4.50 or newer and REW is version 5.20.4.
REW integration is not yet implemented in firmware release 2.0. If you wish to use REW integration, you should roll back to firmware version 1.4.65 with the Release Management System, run RoomMatching with REW, then update to 2.0. Your RoomMatching settings will be automatically migrated to 2.0.
To download REW, click on the link below and download the right version for your system.
Relevance
The audio frequency range can be roughly split in two ranges separated by a “transition frequency”, also called “Schroeder Frequency”. For most professional studio and domestic situations the transition frequency is in the order of a few hundred Hertz. Above the transition frequency the room behaves as a reflector and sound waves can freely travel. Below the transition frequency the room behaves more like a resonator. At lower frequencies, the wavelength of the sound waves is comparable to that of the dimensions of the room (or multiples of it), and acoustic waves interact with hard boundaries (walls, ceiling, floor), which prevent them from traveling. Sound waves are instead “squeezed” in the room and exist as standing waves, which create strong variations in sound pressure level at different positions in the room.
These room resonances can be attenuated by means of acoustical treatment in the form of bass traps. With the 8c, one also has the possibility to do a low-frequency equalization in the 8c to compensate for the effect of the room resonances and obtain an equalized, i.e. “flatter”, low-frequency response in the listening area.
Equalization
The equalization of the low frequency response of the 8c at the listening position has 3 main steps:
- Calculate the average frequency response of the 8c in the listening area.
- Define the target curve, calculate the equalization filters and send them to the 8c.
- Validate the equalization.
1. Acoustical measurements
Equipment. The 8c should be placed at their normal positions, with the correct front-wall boundary settings . The measurement computer running REW and the 8c should be on the same local network. The measurement microphone, a miniDSP UMIK-1 in this example, also needs to be connected to the computer. A typical measurement setup is shown in Fig.1.

REW settings. To enable REW’s connectivity with the 8c, proceed to REW’s preferences, and select the Dutch & Dutch 8c as the default equalizer in the tab Equalizer.
Listening area. The general approach is that one uses an average frequency response in the listening area to calculate the equalization filters. The goal is to obtain a consistent equalized response within the listening area. Given the relatively long wavelength at low frequencies, it is commonly possible to achieve a reasonable equalization for a listening area for a few listeners. More accurate equalizations are however obtained for smaller listening areas.
Measurement locations. To obtain an average frequency response in the listening area, the frequency responses of the 8c is measured at several locations in the area and an average response is calculated by REW. The locations of measurements are chosen to cover the listening area in all 3 dimensions: front/back, left/right, up/down.
For a single person listening area, one measurement is made at the position of the head (center of the listening area) and 6 other measurements are made at the center of the faces of a virtual cube centered on the head. Consider 30cm/1ft from the center of the cube to the faces. For larger listening areas, one may want to have additional points, e.g. 9 points corresponding to the center of the listening area plus the corners of a virtual cube centered at the main listening position, which can be more spread in space. Adding measurement points will increase robustness if desired.
For all measurement locations, the microphone is pointed in the same direction, towards the front of the listening area.
Making a measurement. REW version 5.20 beta 56 is equipped with a measurement interface that directly connects to the 8c and controls the playback of the measurement sweep tones. The interface is accessed by pressing the “Measure” icon on the top-left corner of REW’s interface.
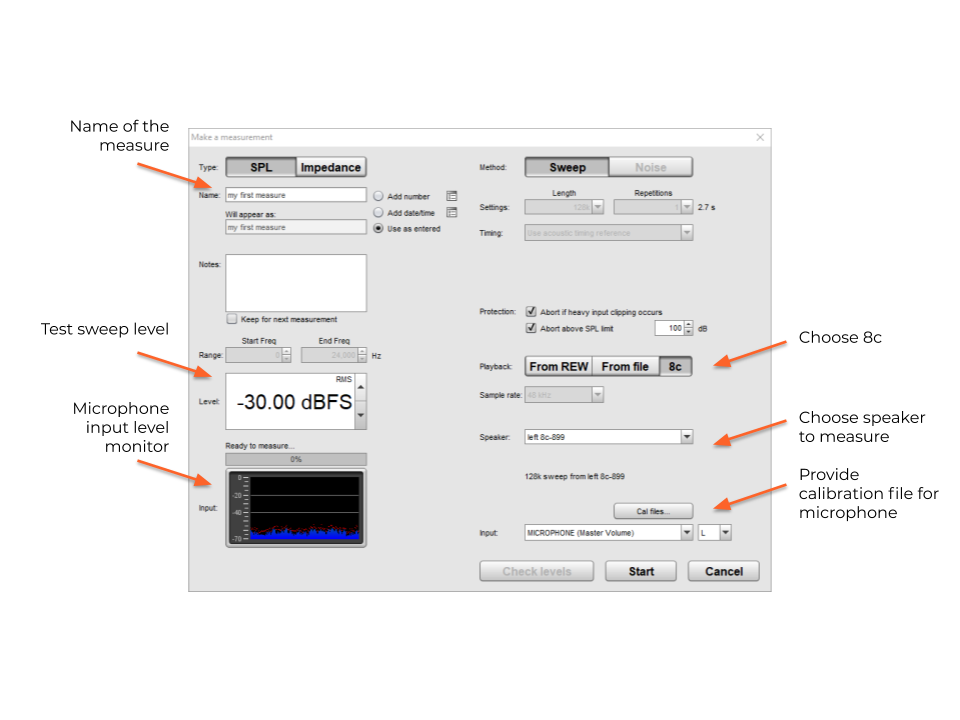
The step-by-step measurement process is as follows:
- Enter a name of the measure in the top-left field for further reference. This is optional.
- Set the level of the sweep tone. Don't set the sweep level too high! For all 8c's with serial numbers above 8c-130, a sweep level of -30dBFS corresponds to a level at the listening position between 75 and 80dB SPL when the internal level of the measured speaker is 0dB (LanSpeaker). 8c's with a serial number lower than 8c-130, play significantly louder. Therefore, first try -45 dBFS. The exact sound level will slightly vary depending on the distance between the 8c and the measurement microphone, as well, as the room characteristics.
- A sweep tone level in the range 70 to 80 dB SPL should be loud enough to have a good signal-to-noise ratio in most environments.
- The playback level of the sweep tone is a function of both the level set in REW and the internal attenuation of the 8c (LanSpeaker).
- Make the measurement by pressing the “start button” at the bottom right corner of the interface.
- Make a measurement at all measurement positions.
- View the frequency response curves under the All SPL tab.
- Set the range of the vertical axis to 60 dB.
- Set the range for the horizontal axis from 10 to 20000 Hz.
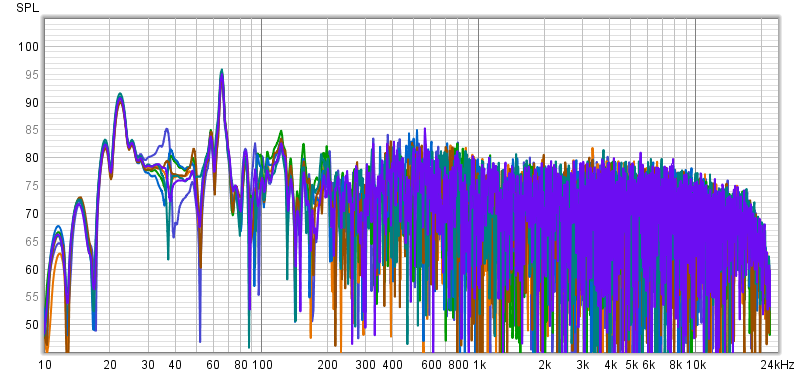
Average response. Figure 3 shows seven unsmoothed frequency responses in a mid-size untreated living room with concrete walls. The goal of the equalization is to particularly attenuate the large peaks, and to a lesser extent the valleys present below 200Hz in this example. One can notice that some of the peaks are present in all 7 measurements (at around 22 and 65Hz), while others are less consistently present in all measurements (between 30 and 40Hz). This illustrates why the equalization is based on the average response in the listening, and attenuate the peaks that are present over the whole listening area.
Once all measurements are present in REW, hit the button “average the responses” at the bottom left corner of the screen. This calculates the average response is used to calculate the equalization filters. It will show up on the bottom of the list of measurements on the left of the screen.
2. Filter calculation and transfer to 8c
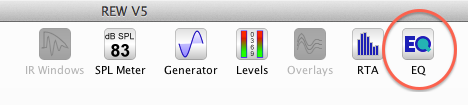
To start the calculation of the filters, load the average frequency response to be equalized (if that was not already in focus) and hit the EQ-button on the top ribbon above the curves.
This brings the filter calculation tool, with the average response to be equalized.
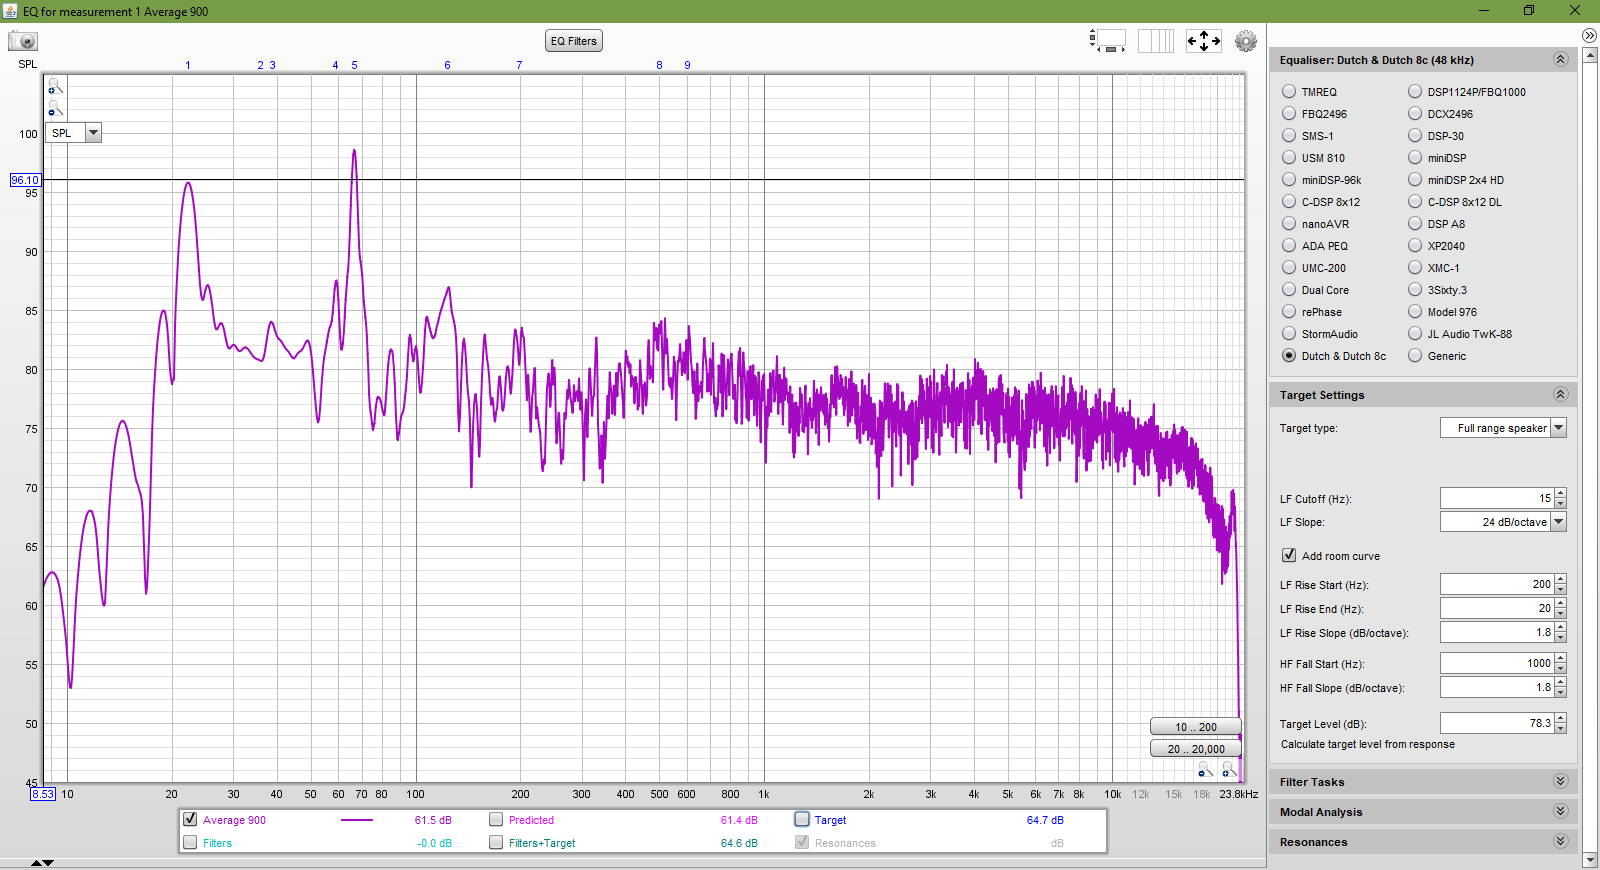
Figure 4 shows the main panel with the average frequency response here unsmoothed (adjusted with the cog wheel in the top-right corner). The panels with the parameters to adjust and calculate the equalization filters are shown on the right.
Some of the relevant parameters to consider with optional adjustments are:
Top panel: Equalizer
- Choose “Dutch & Dutch 8c”, if this is not already selected.
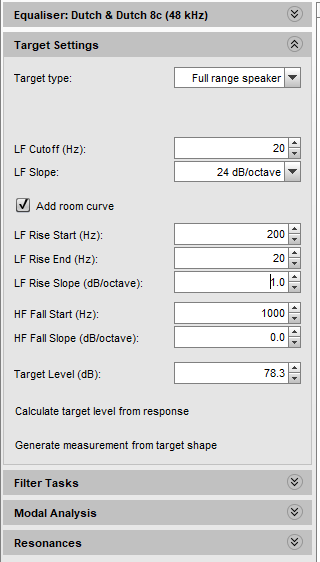
Second panel: Target setting
- Target type: choose “full range speaker”.
- LF Cutoff: The default value is 20Hz. This value can be adjusted depending on the room characteristics.
- Add room curve: If left unticked the target frequency response is flat. This setting is used for measurement in anechoic environments, or near-field measure where the room has nearly no effect on the measure. For the present equalization, it is recommended to select this option, which, by default, raises the target curve by 1dB/octave below 100Hz to better match the preferred in-room frequency response. This aspect can be adjusted to taste.
- Target level: Hit the “calculate target level from response” to set the overall level of the target response. This usually gives a good estimation of a target level.
- Once the target for this speaker has been set, put the cursor anywhere in the Target Settings field, then right-click and copy target settings. You’ll want to use the same target for the other speaker of the stereo pair.
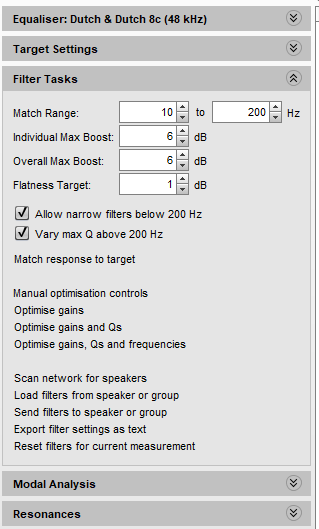
Third panel: Filter task
- Match range: The default lower limit is 20Hz. Ideally, the upper limit should correspond to the transition frequency of the room. This value is often unknown, but it can be safely eyeballed. For most rooms it is expected to be between 100 and 400Hz. It should be set high enough such that any large peaks of the response are corrected, but otherwise as low as possible. Inspecting the unsmoothed frequency response should reveal any strong level variations across frequencies due to room resonances. In Fig. 7, the peak with the highest center frequency that can be attributed to room resonances is arguably at around 200Hz. Smaller variations above this frequency are not due to room resonances but to room reflections and should be left uncorrected and are out of the scope of this guide.
When all settings are set, ensure that the response is shown unsmoothed and click the “Match target response” text to calculate the equalization and observe the calculated target response – See example Fig. 6
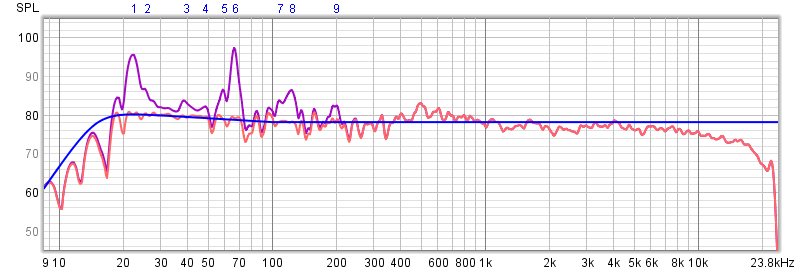
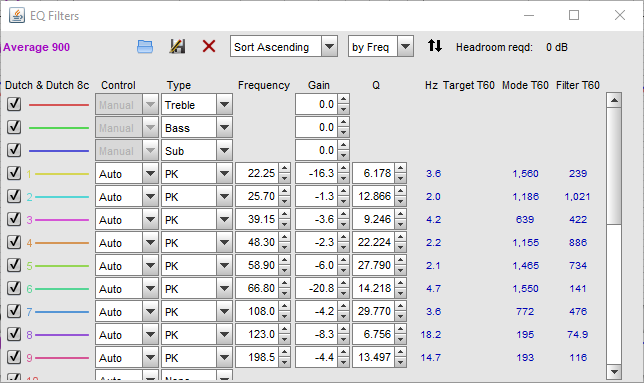
As shown in Fig. 6 the predicted response shows strongly reduced peaks. The human ear has poorer frequency and level resolution below 100Hz, and to get a somewhat more realistic visual representation of what one will hear, one can display the responses smoothed, here shown with 1/24 octave smoothing. The equalization filters characteristics can be seen by hitting the “EQ filters” button above the curve panel. Here is an example with 9 filters:
Click the “Send filters to speaker or group” text in the Filter tasks panel to send the filter characteristics to the desired loudspeaker. The setting of the filters can be checked in the LanSpeaker interface, “Parametric EQ” section. The entire process must be repeated for all speakers. Remember to paste the copied target settings, so the other speaker of the stereo pair gets corrected with the same target curve.
3. Validation of the equalization
The verification of the equalization is done by comparing the frequency response at the center position of the listening area before and after equalization.
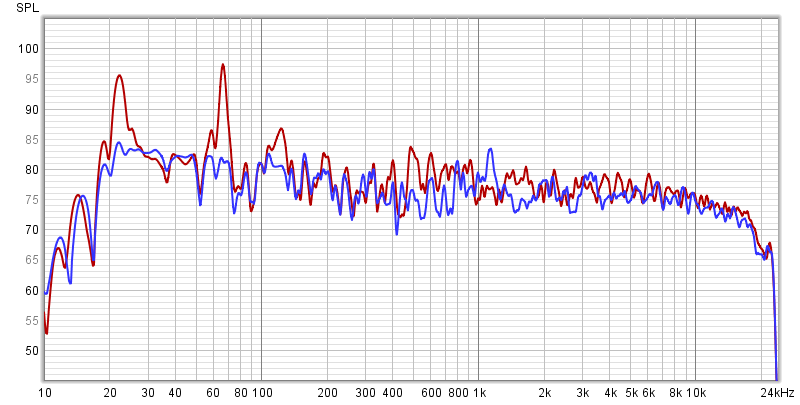
The equalized response is visually close to the target and the predicted response shown in Fig. 6. The large peaks due to room resonance at around 22 Hz, 64 Hz, and 124 Hz have been successfully attenuated. This is a rather good example, and it is not unusual for the filtered response to exhibit residual valleys because they are harder to equalize than peaks. Oftentimes, attempting to correct these valleys is in fact more detrimental than beneficial, because of limitations in dynamic range over narrow frequency bands. Furthermore narrow valleys at low-frequencies are less objectionable to the ear due to limited perceptual frequency resolution and stronger spectral masking at these low-frequencies.
Conclusion
This guide illustrates how Room Matching contributes to making the room disappear for the 8c. The Room Matching process provides a straight-forward process to make the response of the 8c at the listening position more balanced at low frequencies, and thereby contributes to the overall accuracy and clarity of the 8c.
Note: discovery issues
The 8c discovery tool in REW is not always able to find the 8c's on the network. This issue is currently under investigation. The following steps may fix the issue for you there is no guarantee:
Step 1. Close REW
Step 2. Disable WiFi adapter
Step 3. Disconnect computer/laptop from the internet (pull cable)
Step 4. Install a router near the speakers disconnected from the internet
Step 5. Connect speakers to router
Step 6. Connect computer/laptop to router with ethernet cable
Step 7. Start REW (edited)
When the issue is resolved, this note will be updated.